Accelerating landscape change threatens biological diversity worldwide. Therefore, documenting trends in the extent and condition of ecosystems provides a key foundation for conservation action. Risk assessment of ecosystem types provides a complement the IUCN Red List of Species and NatureServe Conservation Status ranks. Assessment of ecosystem types addresses ecological processes for many species that share similar habitat requirements, and for many other species for which little is known.
We have published our assessment of terrestrial ecosystems in temperate and tropical North America North America in the scientific journal Conservation Science and Practice. This is part of NatureServe’s contribution toward worldwide implementation of the IUCN Red List of Ecosystems (RLE). The scientific aim of RLE efforts is to document the conservation status of terrestrial ecosystems by developing a series of baselines across the continental distribution of each type, assessing land cover change against these baselines, quantifying the drivers of change, and applying the Red List criteria to each ecosystem type. In North America, NatureServe terrestrial ecological systems are primary units of assessment of terrestrial ecosystems.
Find data for this project at the EBV Data Portal or download it directly from NatureServe.
The red listing process involves:
- Classification and description of ecosystem types
- Description of natural environmental setting, key ecological processes and interactions, major threats and stressors, and indicators of ecological collapse
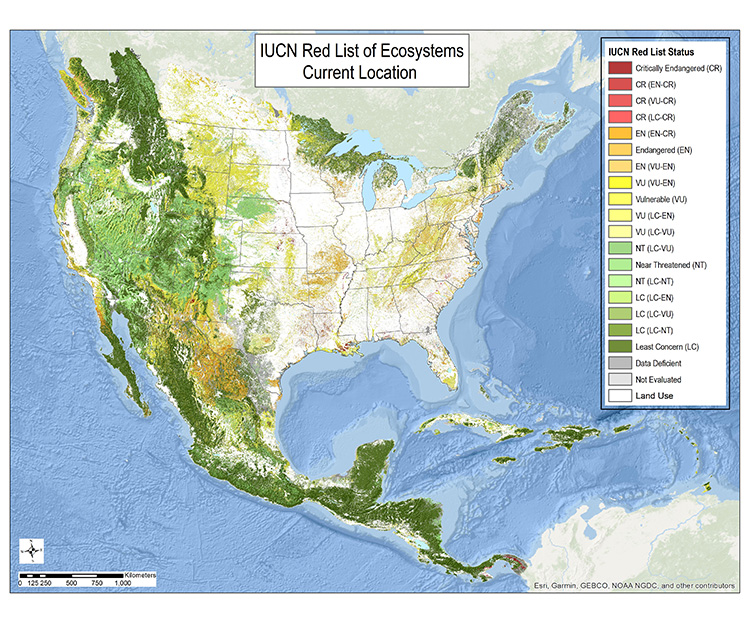
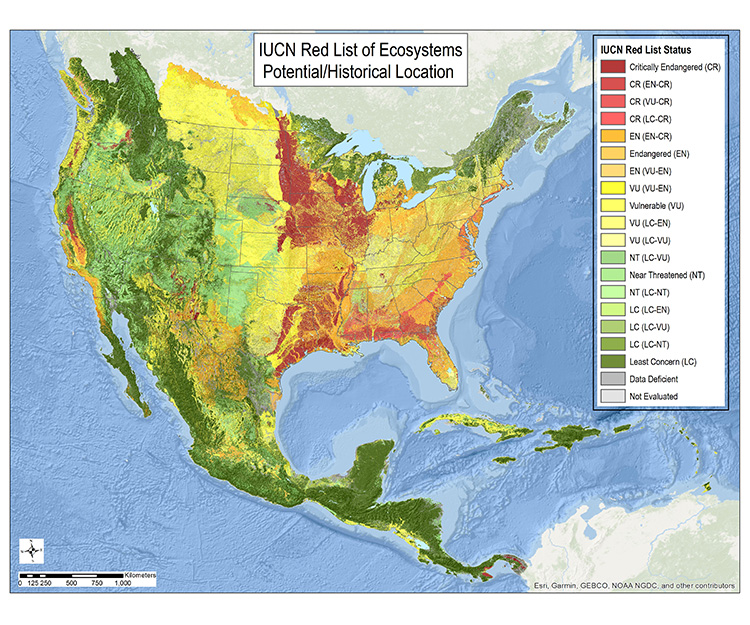
- Maps of potential/historical as well as current distribution
- Maps depicting stressor and condition indicators
- Tabular summaries of applied IUCN assessment criteria
- Maps depicting location of ecosystem types scored as Vulnerable, Endangered, and Critically Endangered
After an initial focus on terrestrial (i.e., upland and wetland) ecosystem types, we aim to expand assessments to other realms (freshwater aquatic, marine, subterranean).
Through this process, we document which ecosystem types should be considered “Vulnerable (VU)” “Endangered (EN)” or “Critically Endangered (CR)” using IUCN criteria. Other categories include "Near Threatened (NT)" "Least Concern (LC)" and "Data Deficient (DD)" and "Not Evaluated (NE)." With several hundred described and mapped types as assessment units, we document which forest, savanna, shrub-scrub, grassland, desert, wetland, and riparian types are of most urgent conservation need.
As compared with individual species, ecosystems represent recurring patterns of species assemblages that reflect biogeography, patterns in the physical environment, and dynamic ecological processes. Outright conversion (e.g., for intensive agriculture), or change in either the physical environment or dynamic processes may result in a departure from expected species composition. Therefore, ecosystem risk assessment aims to detect trends in the magnitude of change to species composition. Threats to ecosystems result in a departure from expected species composition to varying degrees. For ecosystems, the analog to species extinction (i.e., population collapse) is the transformation of species composition and ecological processes to an alternate condition from that which was previously supported. Therefore, the “collapse” of a given example of an ecosystem type occurs where ecological conditions have transformed beyond recognition.
Red List Status in Temperate and Tropical North America
Application of IUCN Red List of Ecosystems criteria in North America provides a demonstration of an approach to rapidly assess the majority of types and “paint the picture” of ecosystem status. Following from this analysis, investments to fill key information gaps may be targeted to maximize their impact and complete the picture.
We assessed 655 terrestrial ecosystems occurring from southern Canada south through Panama and the Caribbean, or 8.5% of the global land surface. A series of indicators were measured for each criterion to address trends in ecosystem extent (A), the relative restricted nature of its distribution (B), and the extent and relative severity of environmental degradation (C) and the extent and relative severity of disruption of biotic processes (D); all to gauge the probability of range wide “collapse.”
Taking uncertainty into account, 219 (33%) of terrestrial ecosystem types were listed as threatened (i.e., either Critically Endangered, [7%], Endangered [14%], or Vulnerable [13%]). Examples include tallgrass prairies, oak savannas, longleaf pine woodlands, floodplain forests, mesic hardwood forests, and dry tropical forests. Historically, these threatened ecosystems occurred across about 45% of the continental study area, and today account for about 30%.
| RLE Status | # of Types | % types | Total Potential Extent (km2) | % historic land area | Sum of Current Land Area (km2) | % total land area |
| CR | 41 | 6% | 775,162 | 6.75% | 78,947 | 1.05% |
| CR (EN-CR) | 5 | 1% | 76,014 | 0.66% | 9,083 | 0.12% |
| CR (LC-CR) | 1 | <1% | 243 | <0.01% | 241 | <0.01% |
| EN (EN-CR) | 7 | 1% | 134,846 | 1.17% | 43,958 | 0.59% |
| EN | 61 | 9% | 1,041,279 | 9.07% | 322,426 | 4.30% |
| EN (VU-EN) | 23 | 4%41 | 374,372 | 3.26% | 275,106 | 3.67% |
| EN (LC-EN) | 1 | <1% | 4,834 | 0.04% | 1,995 | 0.03% |
| VU (VU-EN) | 10 | 2% | 135,895 | 1.18% | 52,050 | 0.69% |
| VU | 72 | 11% | 2,672,396 | 23.28% | 1,470,144 | 19.62% |
| VU (LC-EN) | 10 | 2% | 279,344 | 2.43% | 213,990 | 2.86% |
| VU (LC-VU) | 20 | 3% | 166,242 | 1.45% | 183,892 | 2.45% |
| NT (LC-VU) | 3 | <1% | 37,972 | 0.33% | 13,375 | 0.18% |
| NT | 43 | 7% | 1,438,823 | 12.53% | 1,131,782 | 15.11% |
| NT (LC-NT) | 3 | <1% | 122,358 | 1.07% | 148,454 | 1.98% |
| LC (LC-EN) | 1 | <1% | 17,056 | 0.15% | 25,402 | 0.34% |
| LC (LC-VU) | 6 | 1% | 79,059 | 0.69% | 57,818 | 0.77% |
| LC (LC-NT) | 6 | 1% | 45,002 | 0.39% | 57,818 | 0.77% |
| LC | 178 | 27% | 3,308,093 | 28.81% | 2,868,761 | 38.29% |
| DD | 153 | 23% | 732,060 | 6.38% | 439,833 | 5.87% |
| NE | 11 | 2% | 40,629 | 0.35% | 96,200 | 1.28% |
| Total | 655 | 11,481,679 | 100% | 7,491,275 | 100% |
Given the continental scale of this analysis, and reliance on spatial data sets, we have utilized the option to score types within a plausible range (e.g., VU (VU-EN)). This provides a practical indication of our confidence in overall scores and points to types that could use additional investments in data and analysis to increase our confidence and specify their scores.
Ecosystem types, such as forests, grasslands, and wetlands form the life support system for humanity, providing the foundation for all ecosystem services. As a companion to the Red List of Species, the IUCN Red List of Ecosystems provides a mechanism for integrating global data and knowledge to document trends in the extent and condition of ecosystems. Findings from these assessments feed directly into efforts to prioritize conservation action, such as the identification of Key Biodiversity Areas and lands to conserve under the global 30 X 30 goal, conserving 30% of lands and waters by 2030. Additionally, outputs of these analyses support raising citizen awareness, informing policymakers, and directing public and private investments towards sustainable ecosystem protection.
By applying Red List criteria to an established classification of ecosystem types, we provide one important focus for governments and researchers to further develop robust data sets that are critical to natural resource conservation assessment, planning, management, and monitoring.
For More information visit on the IUCN project visit: IUCN Red List of Ecosystems.